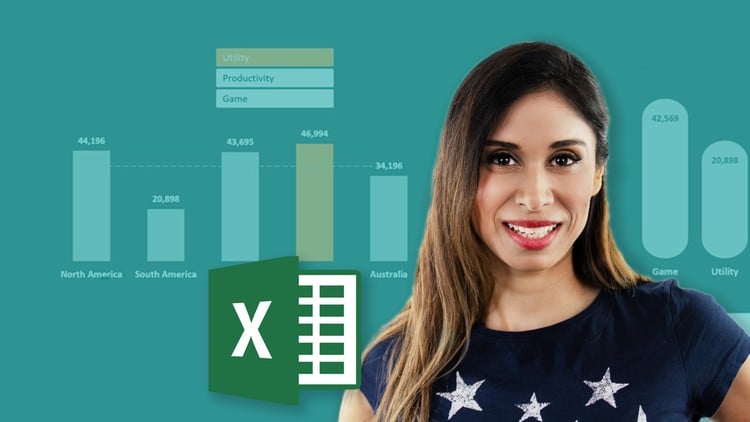
Visually Effective Excel Dashboards

- Description
- Curriculum
- FAQ
- Reviews
Creating an impressive, interactive Microsoft Excel Dashboard from scratch is not easy!
I used to stare at my empty sheet and wonder where do I even start?
You need a structured process in place to go from idea to outcome in a smooth way.
You’ll find out all about it in the course. We setup two fully functioning dashboards from scratch.
This course doesn’t just teach you a set of functions and features, but how you can use them together to create impressive reports.
It teaches you how to approach a new Dashboard project and how to structure your work so maintaining the dashboard becomes very easy not just for yourself but for anyone else.
★ Note: Course recently updated to include the OFFICE 365 & OFFICE 2021 version of the KPI dashboard. You can download that version if you have Office 365 and see how you can use FILTER, SEQUENCE, XLOOKUP and other newer Excel functions to create the dashboard ★
What students are saying
“This course provides a lot of great tips which you can immediately apply to your spreadsheets, no matter what standard of user you are. I have been working in excel for a number of years and I am amazed at the number of simple tips I have learnt in such a short time. Fantastic.” — Carl Postians
“I learned something new and very useful in the first 10 minutes…awesome!” — Nancy Bowens
What you learn
This course teaches you to create well-designed Excel dashboards so you and your colleagues can see trends and make quick decisions informed by data.
This Microsoft Excel Dashboard course comes with templates, tools and checklists that can be applied directly to your Excel reports.
-
Excel dashboard & Report templates
-
Checklists and design guidelines
-
Excel workbook to follow along
What differentiates this course from the other Microsoft Excel Dashboard courses?
It includes:
-
The entire process from idea to delivery – every single step without skipping key points.
-
Tried-and-trusted techniques that are not only applicable to Excel dashboards but any Excel report.
-
Includes Excel templates, tools and checklists that you can use for your own Excel reports.
-
Relevant and up-to-date with industry needs right now, as it’s based on feedback and suggestions from finance professionals.
-
Lots of ideas and inspiration to help you come up with own report design
Complex topics are taught in a simple way by an instructor with 17 years of experience.
The course is designed to have an even balance between talking head and screen-cast.
Content is clearly organised so more advanced learners can jump in at any point and follow along with the relevant project file.